How to get detailed Claude Code Analytics using Sniffly
I got to know about Sniffly today.
It’s Claude Code Analytics dashboard that you can run in your system which will give use the logs that were available in your local machine (~/.claude) to generate a detailed analytics of your usage.
Unlike ccusage, Sniffly gives you detailed analytics on your usage.
For example, you can:
- Project via cost split up
- Error distribution
- Interruption rate
- Tool usages
And much more 👉 https://x.com/chipro/status/1945527700808184115
And the best part is, it is open source 🌟
How to run it get started?
Just run the following command.
uvx sniffly@latest init
If uv is not available then you can install it via pip as well
pip install sniffly
sniffly init
Once you run the command, it’ll start dev server. From there you should be able to access the dashboard.
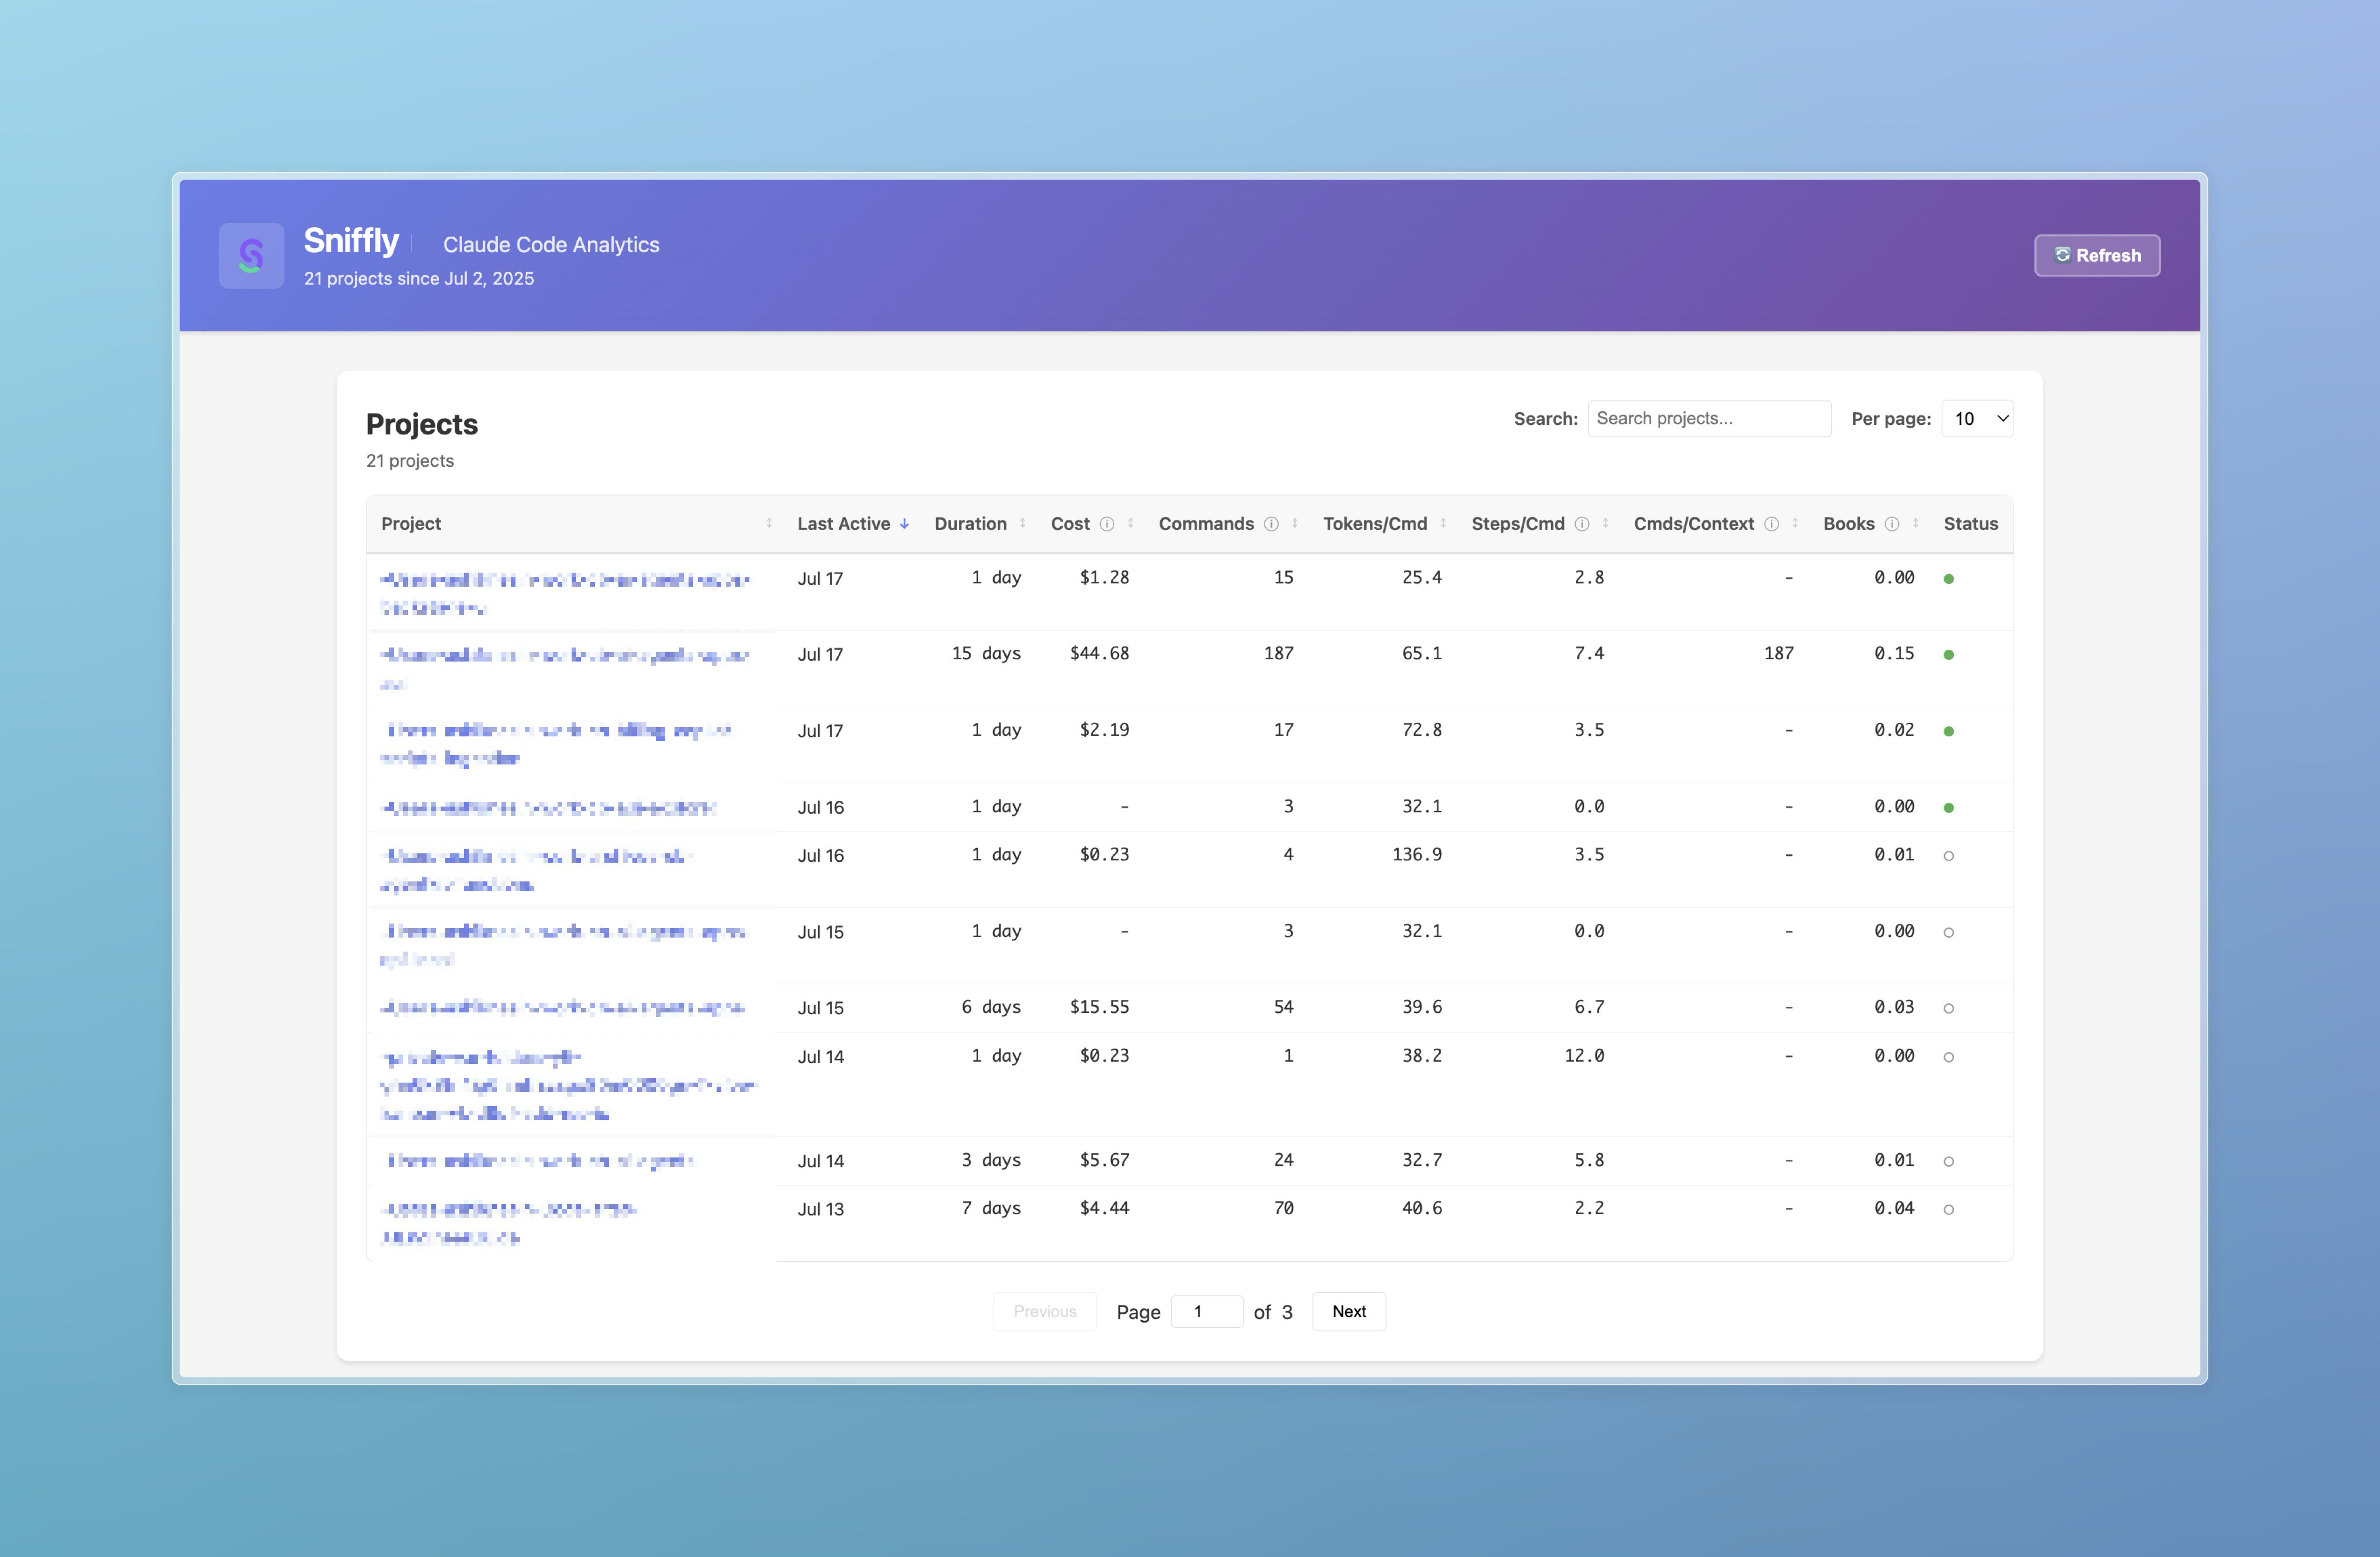
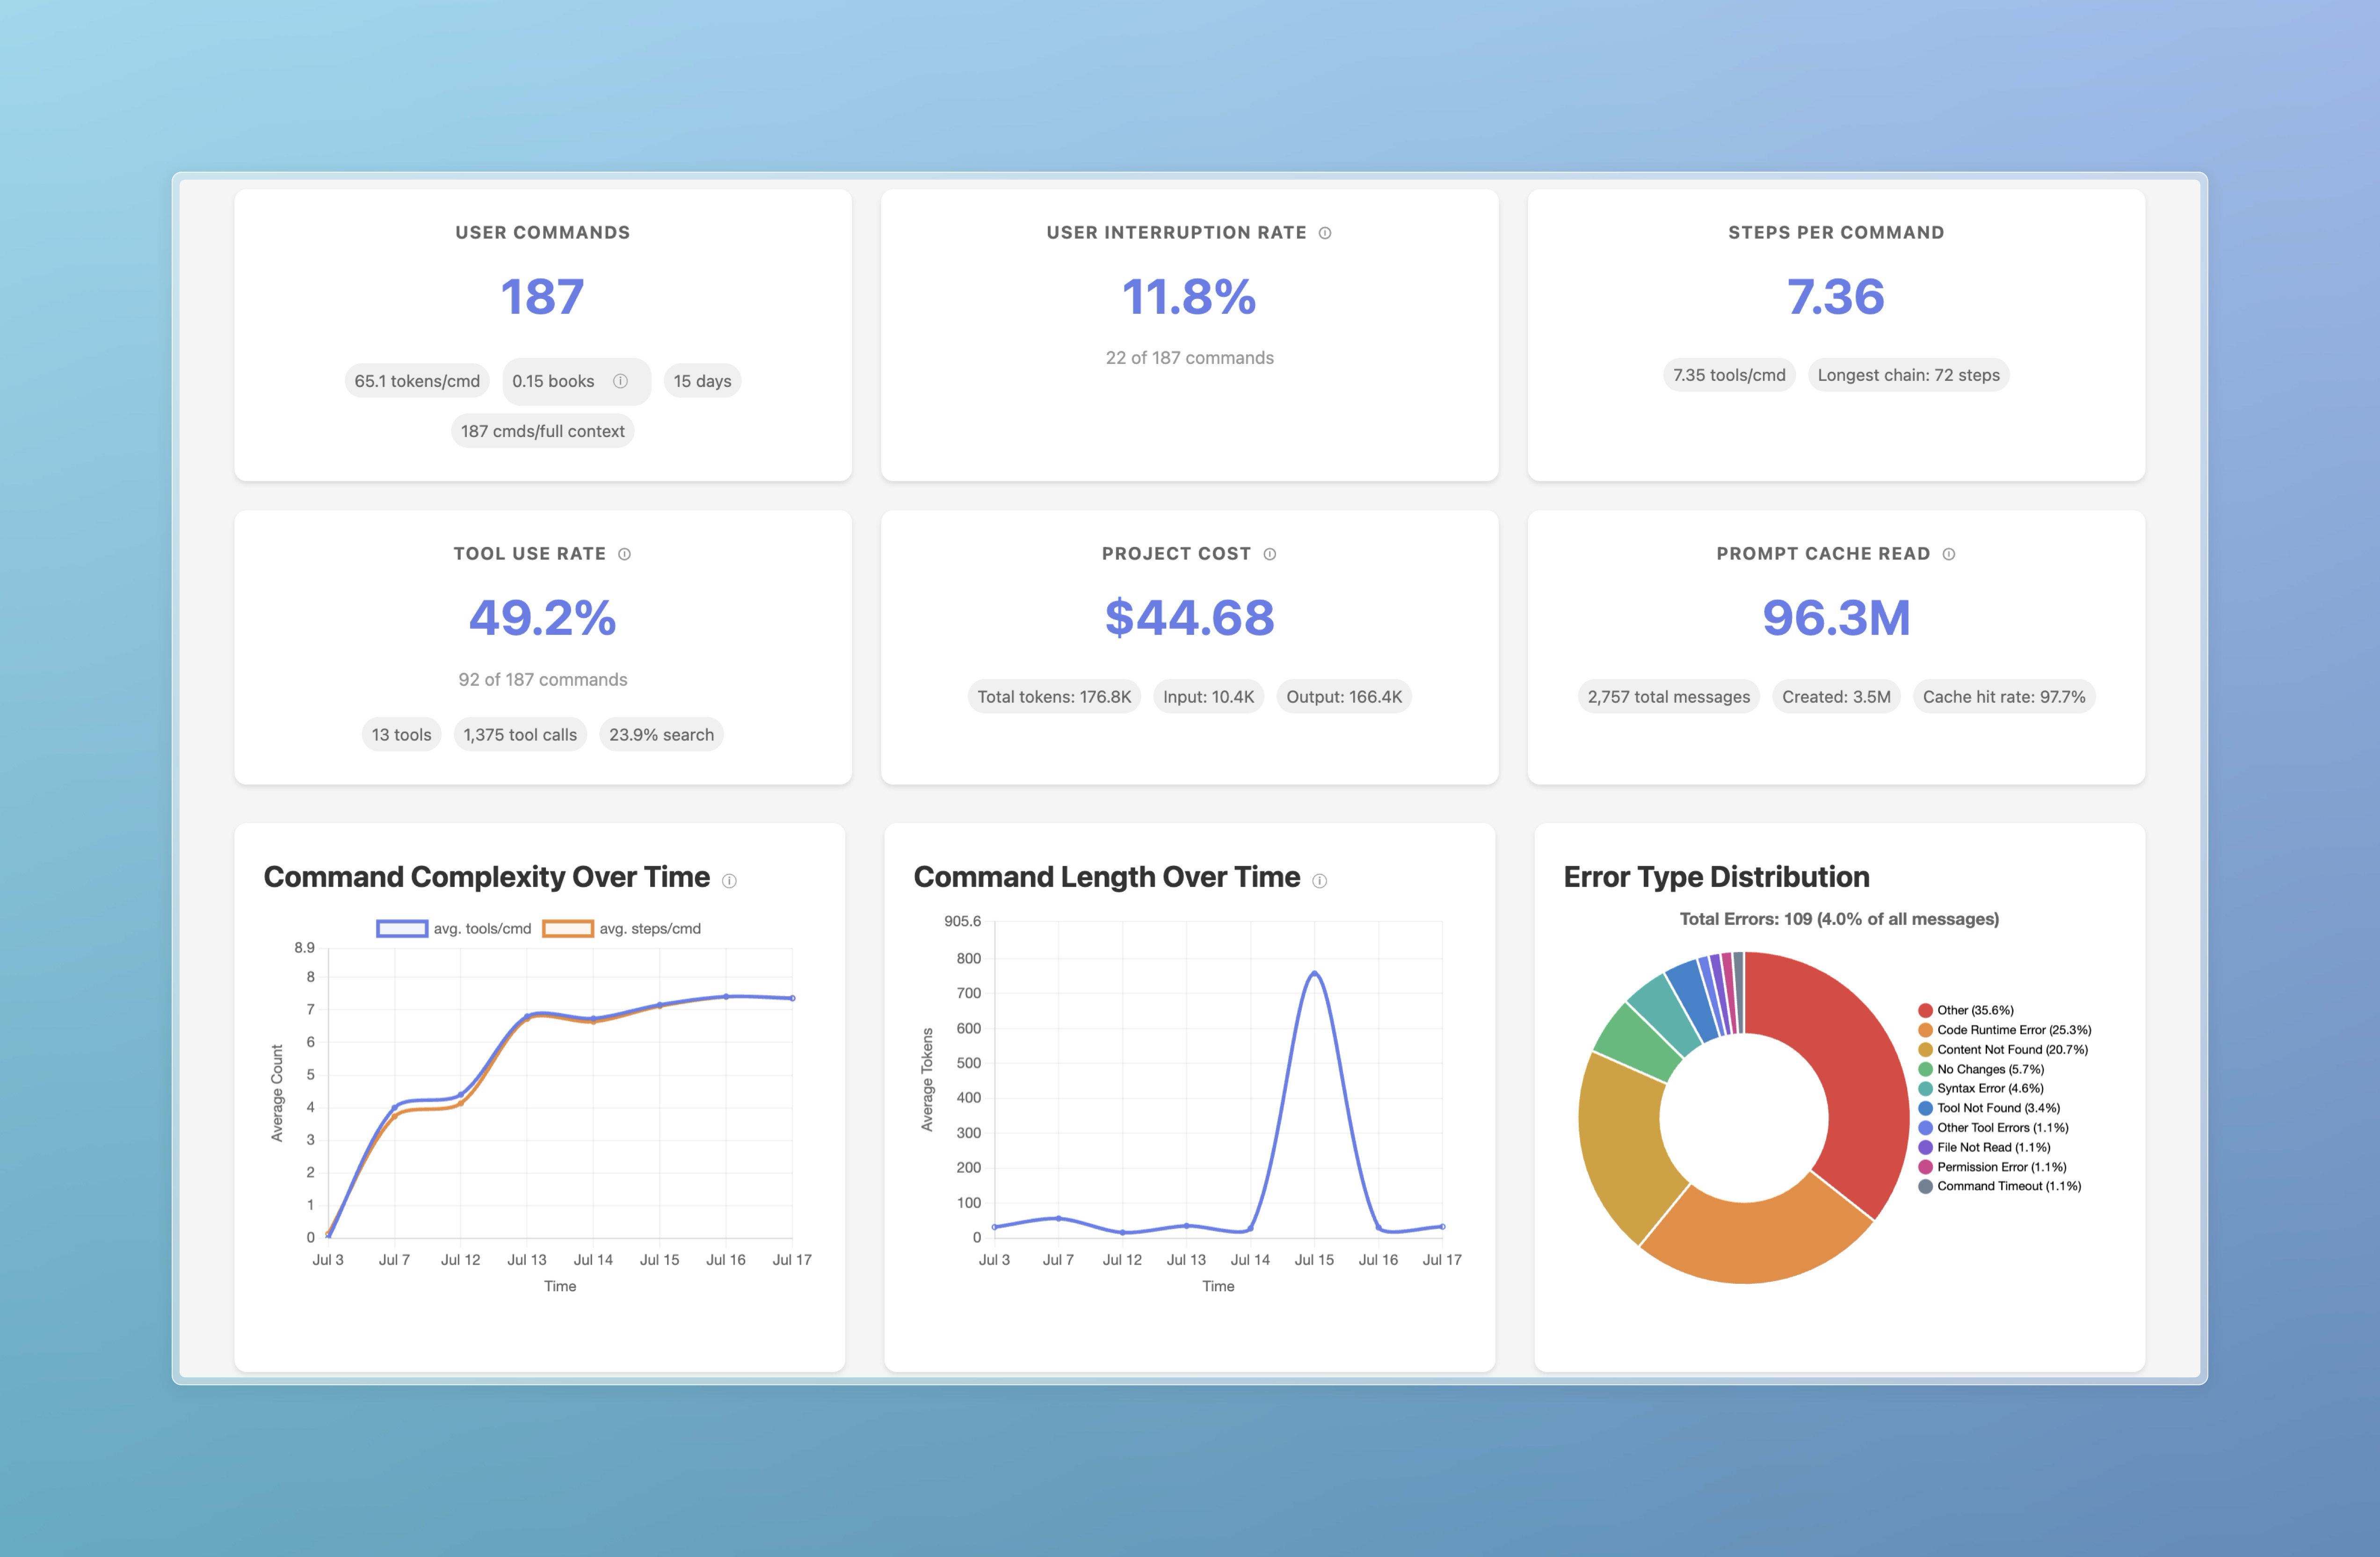
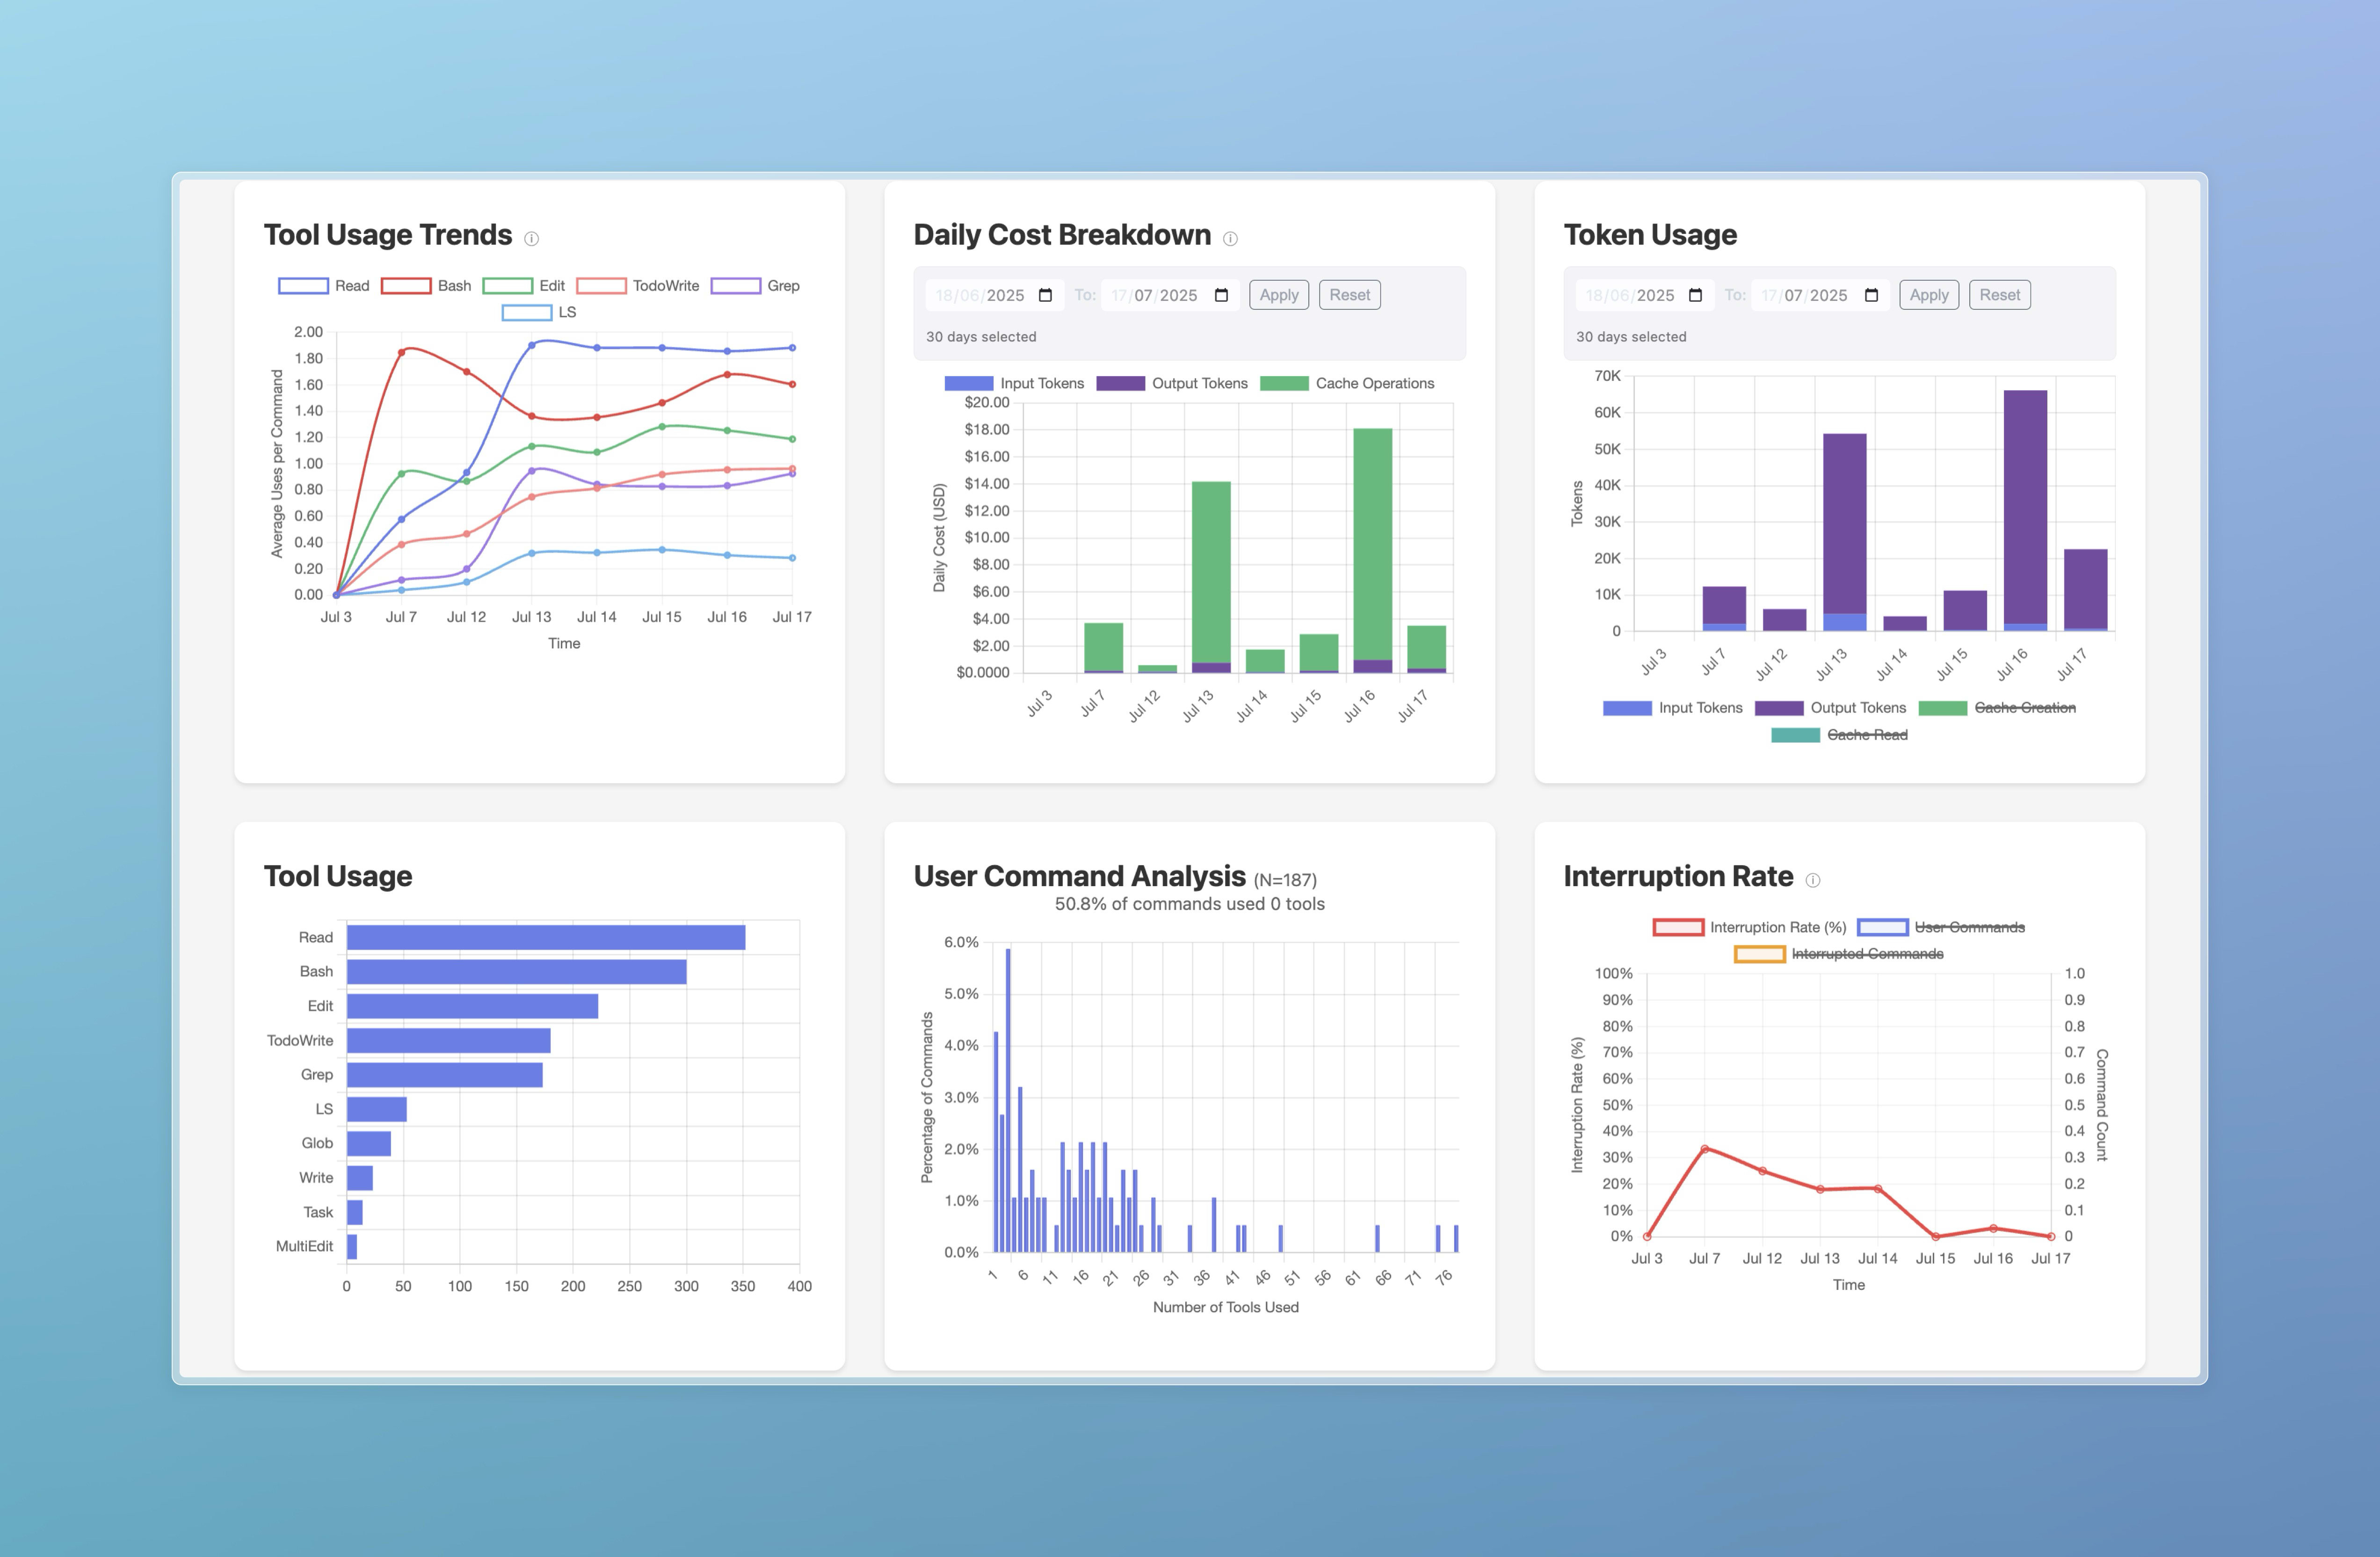
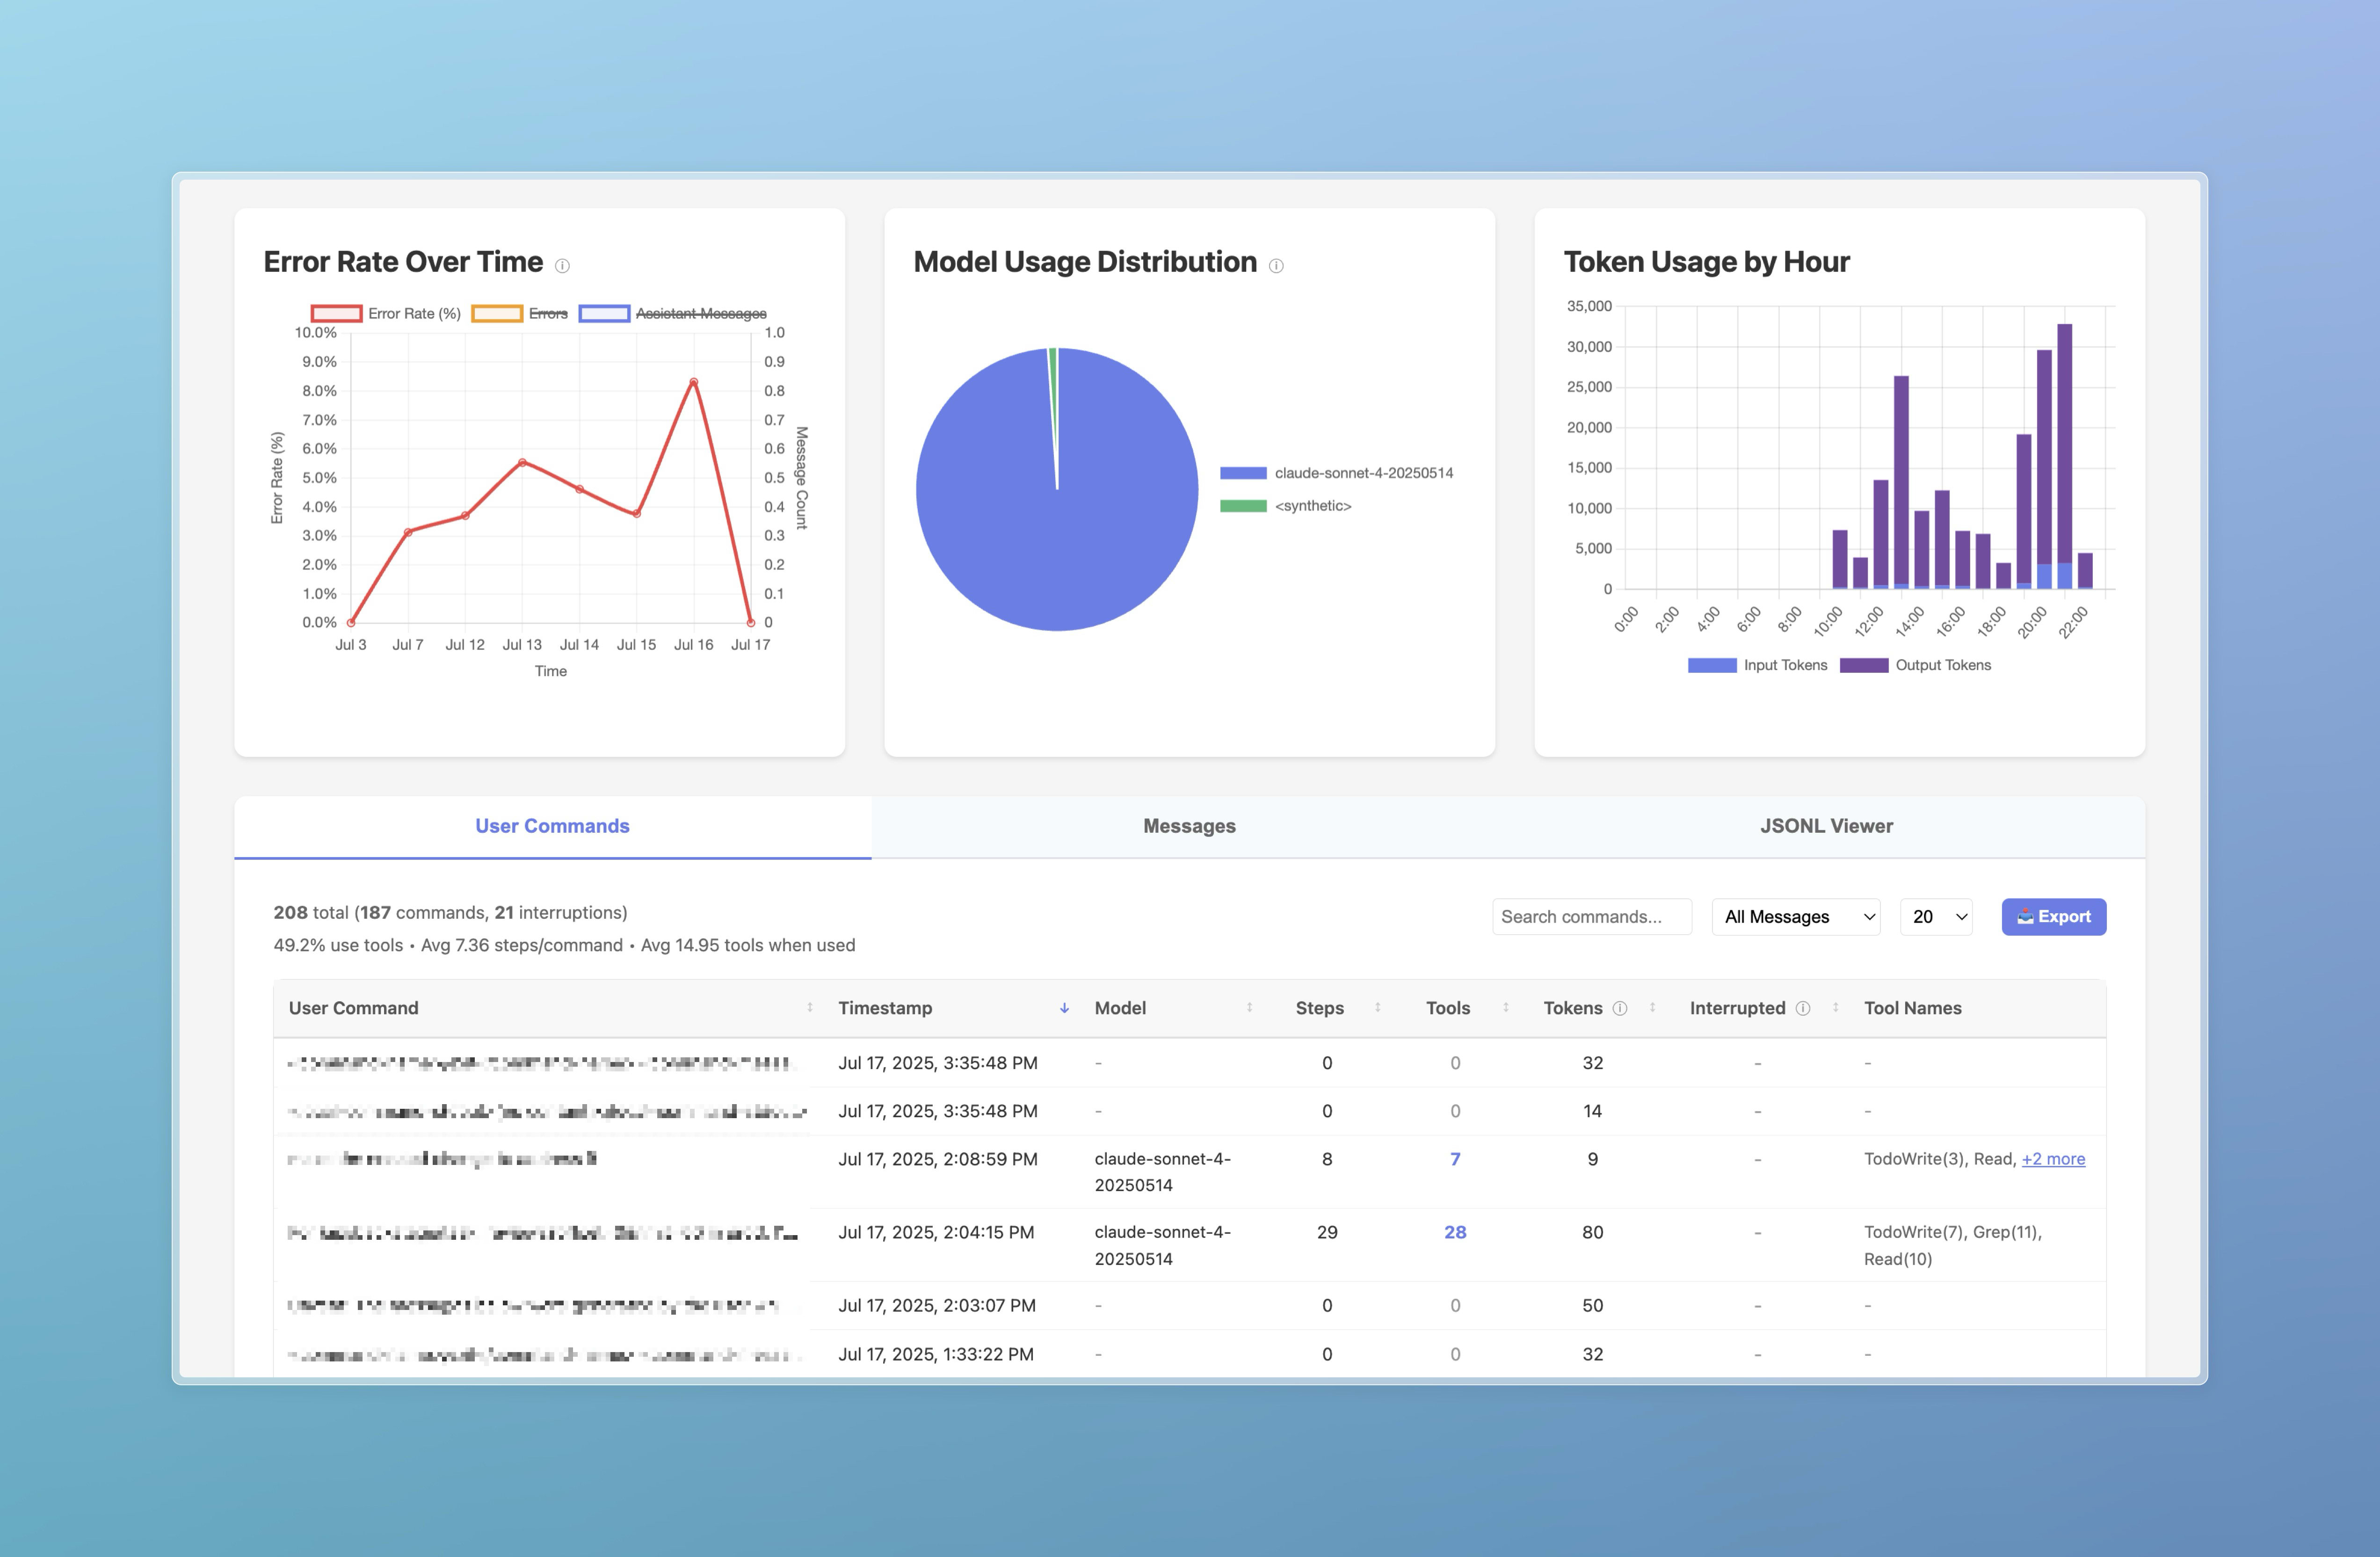
Here are some of the screenshots when I ran it locally.
Happy Claude Analytics!
