How to debug your active browser session with Chrome DevTools MCP

Chrome now has first class support for DevTools MCP.
Once you enable it, you can easily let the AI agents to debug the current session.
By using the current session, you don’t have to worry about Captcha, Login, etc. Since it’ll just reuse the same session in which you’ve already done it.
How to get started?
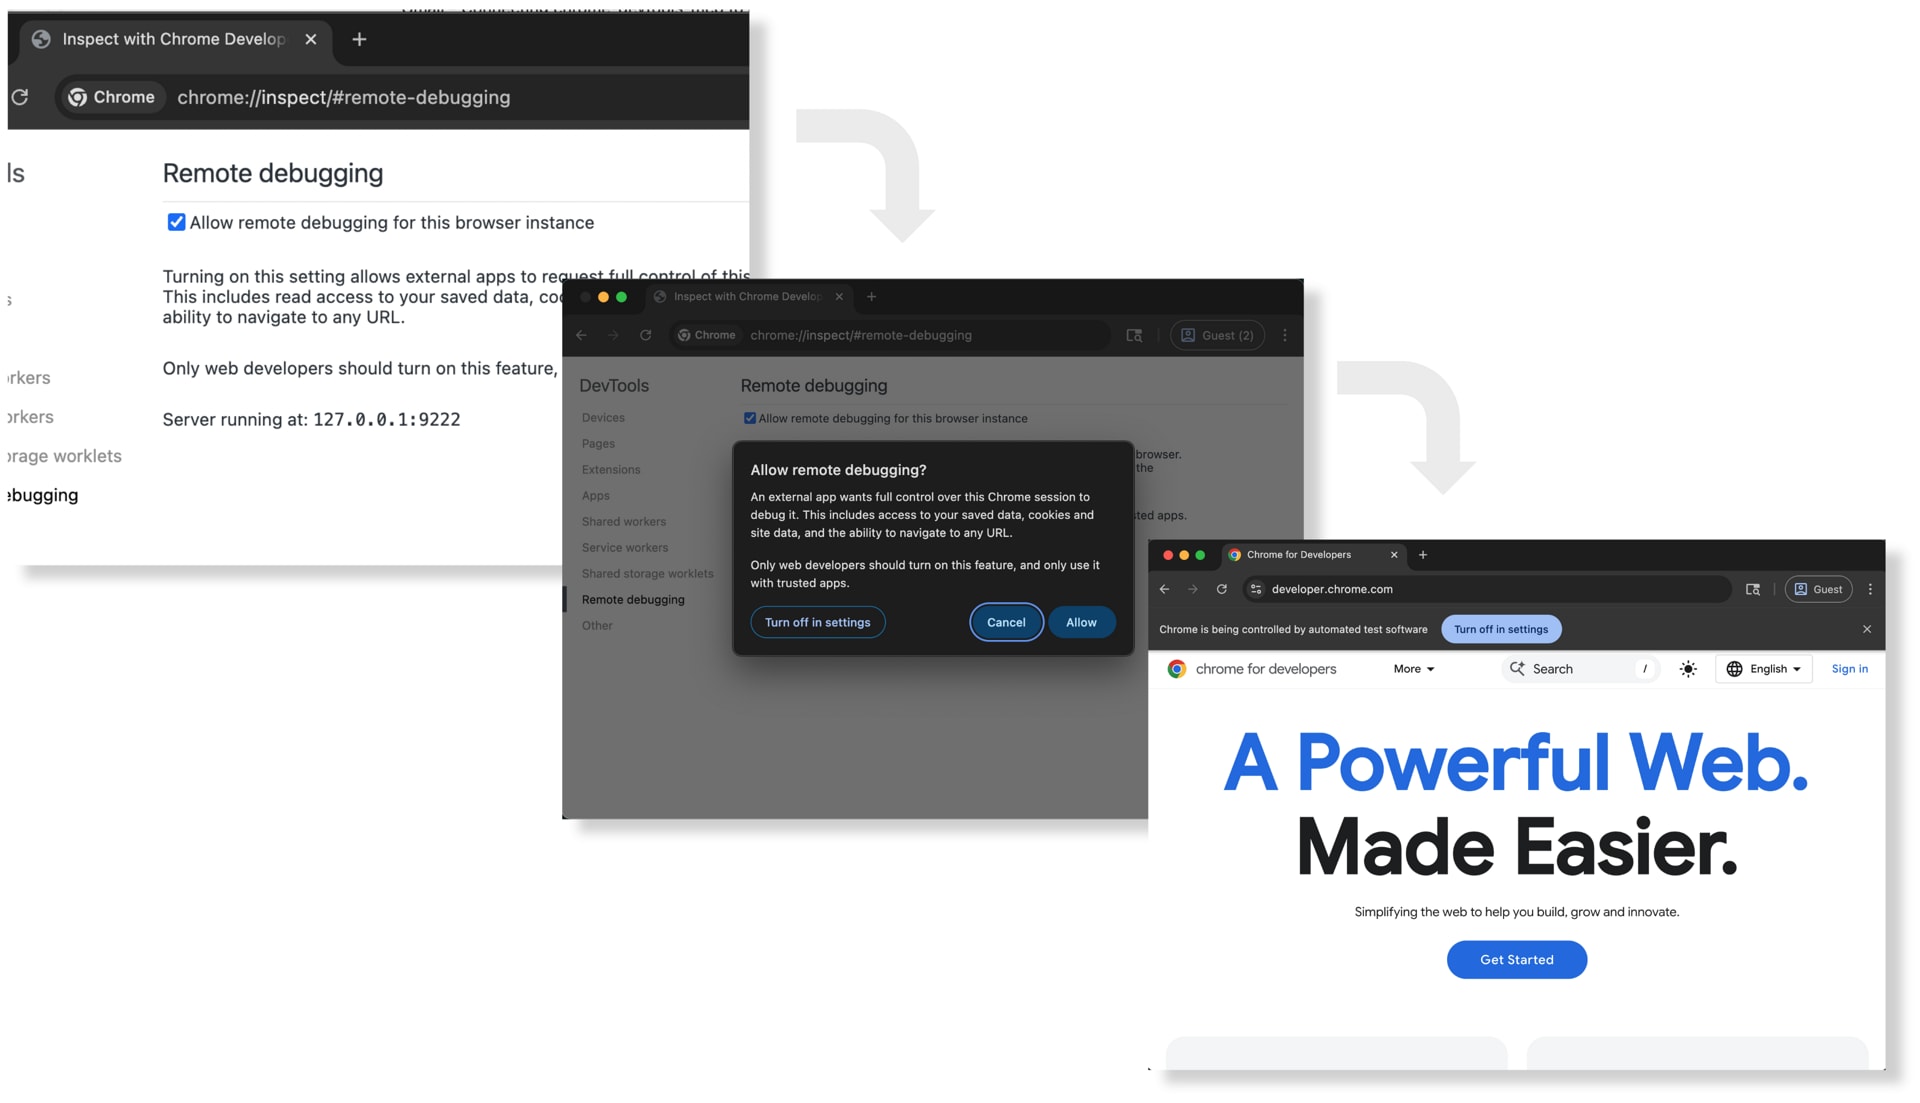
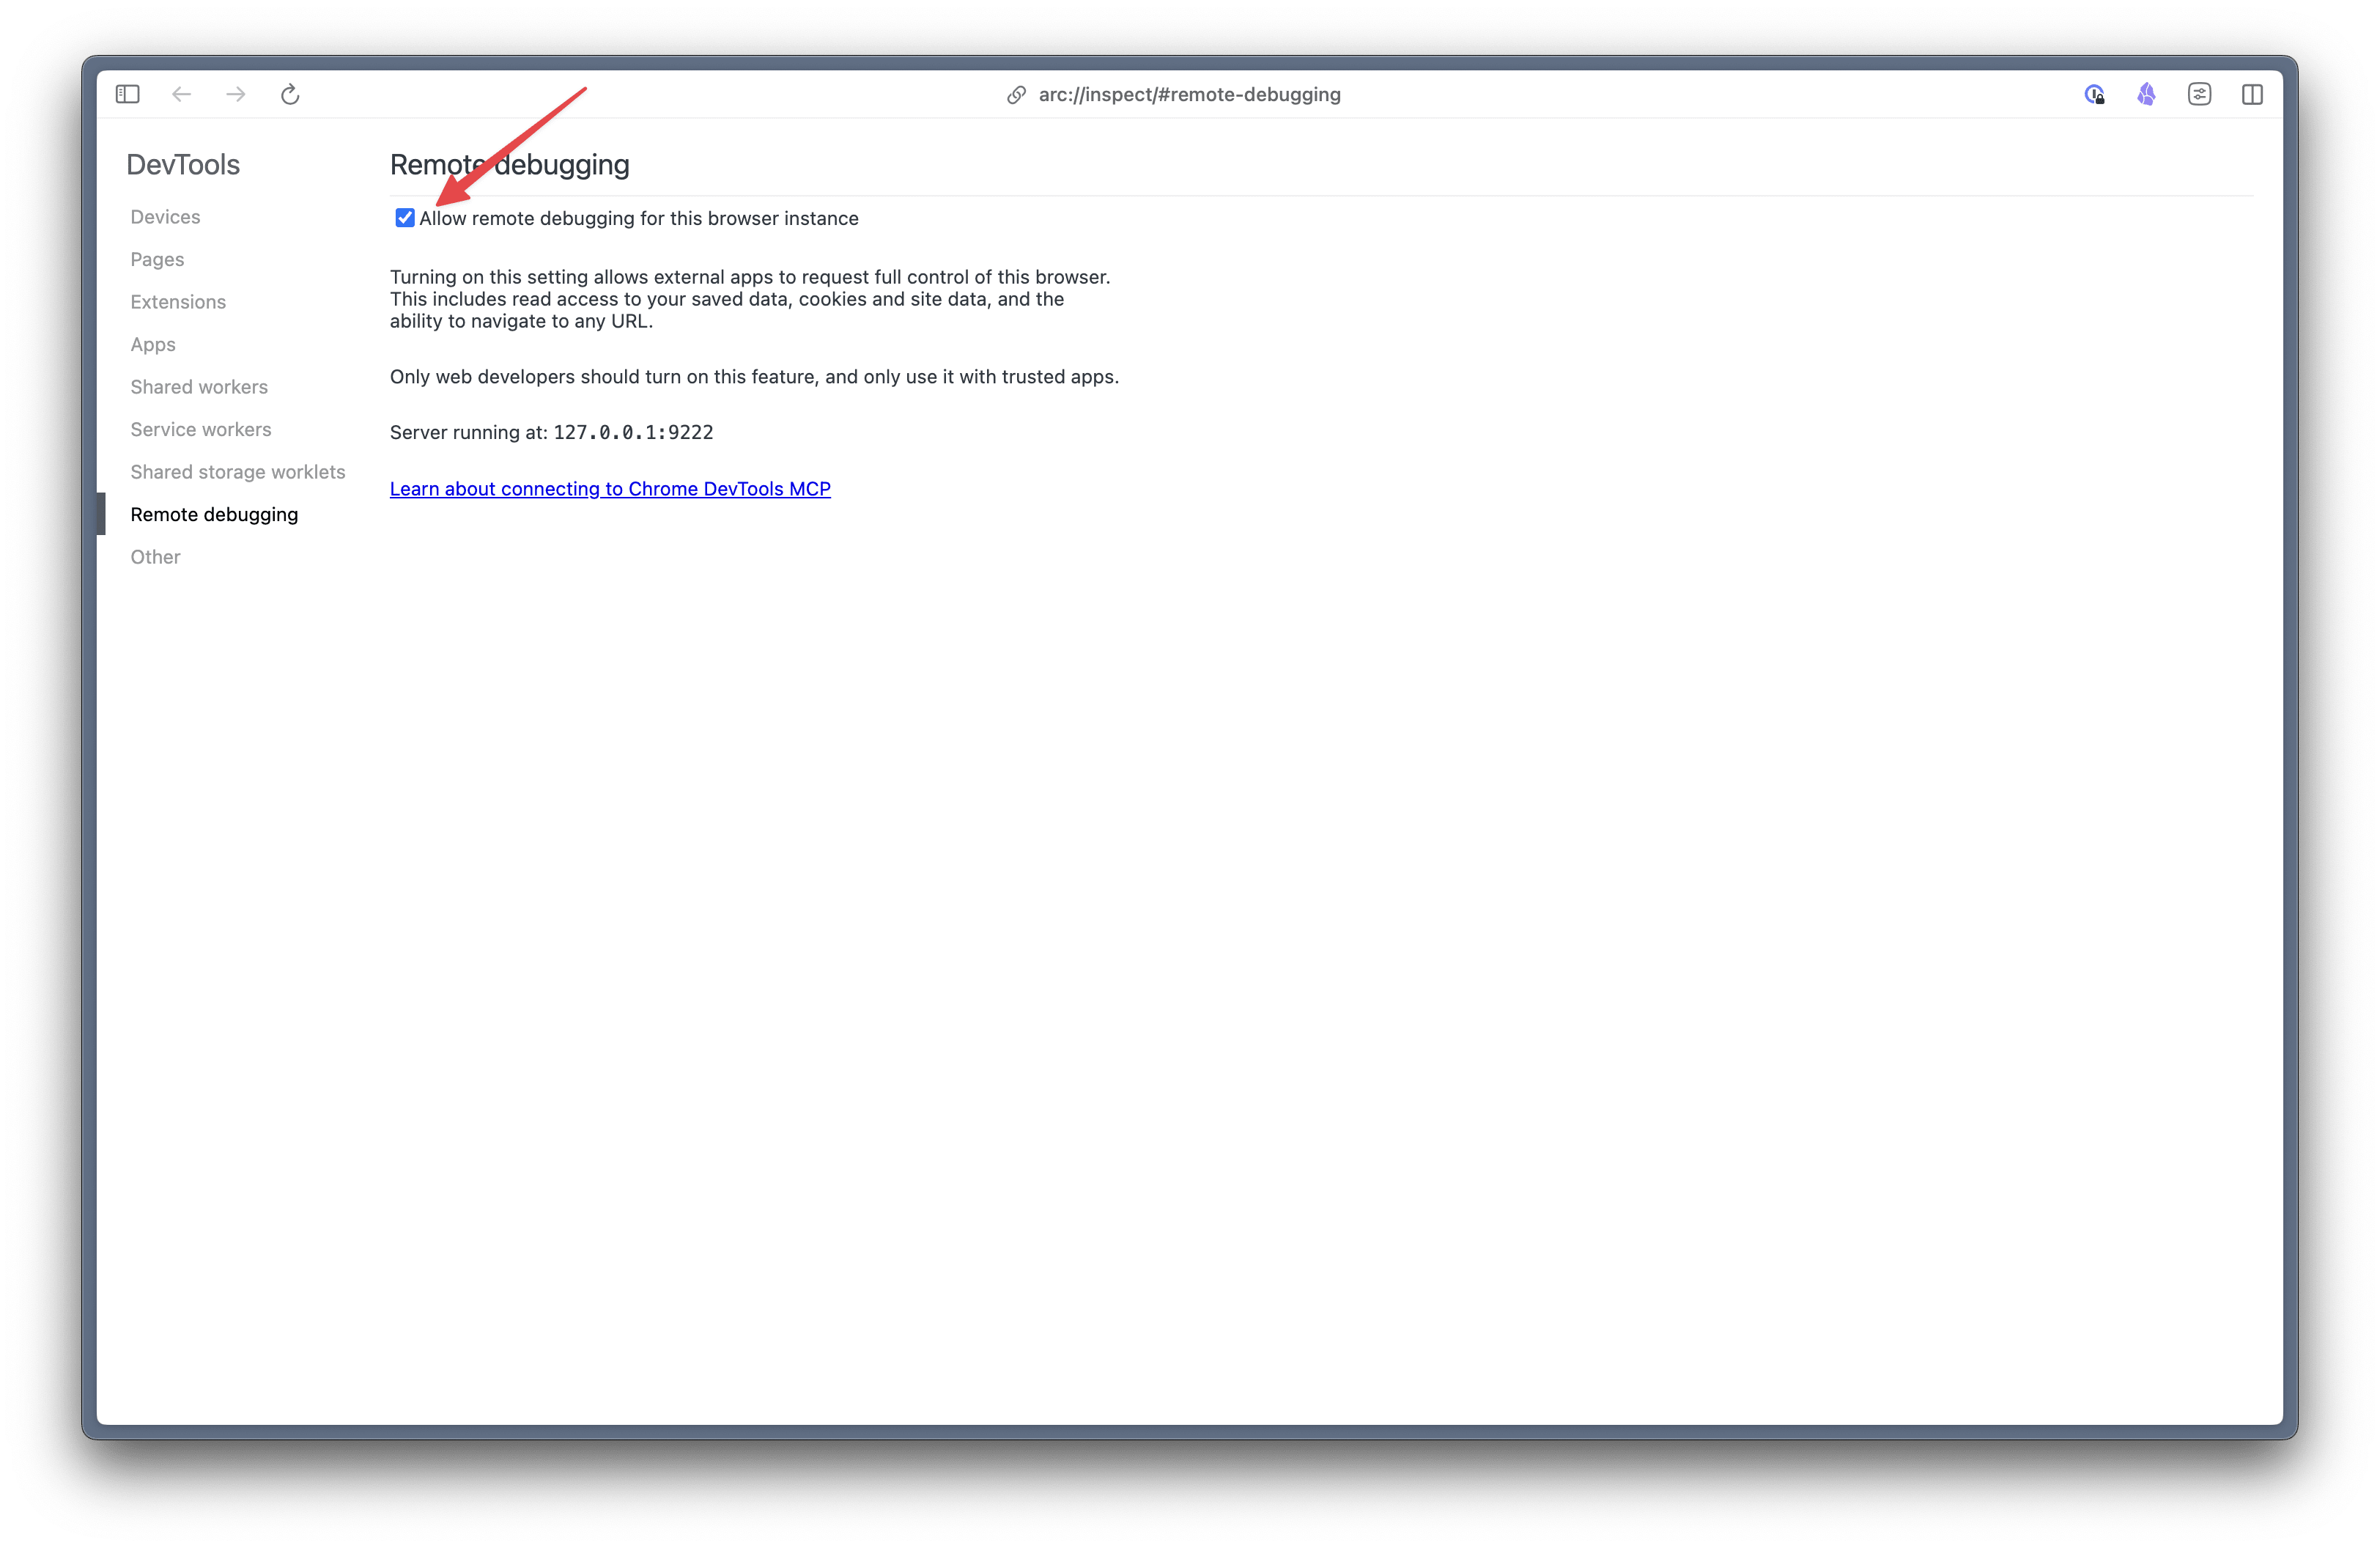
By default, this feature is disabled, you can enable it over here chrome://inspect#remote-debugging
And then in the mcp in which you’re connecting, make sure to pass --autoConnect flag as well.
{
   "mcpServers": {
    "chrome-devtools": {
      "command": "npx",
      "args": [
        "chrome-devtools-mcp@latest",
        "--autoConnect",
        "--channel=beta"
      ]
    }
  }
}
To prevent, misuse Chrome will ask confirmation everytime you interact with it.